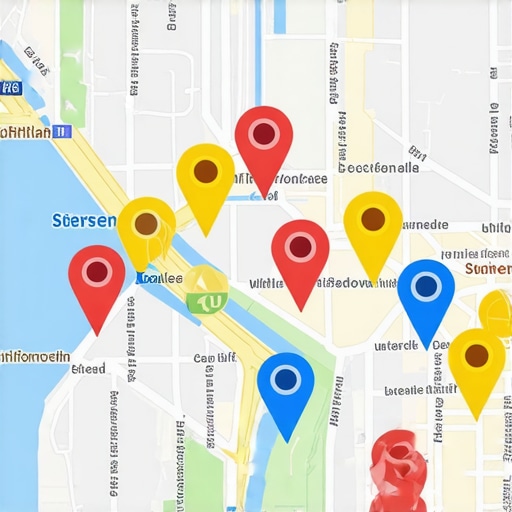
The Simple Move to See Where Your Map Pins Actually Show Up in Other Zip Codes
In my years of helping businesses dominate the local landscape, I’ve encountered what I call the “Proximity Paradox” more times than I can count. Picture this: A business owner is standing in their front office, pulls out their phone, and searches for their primary service. Boom – there they are, sitting pretty at #1 in the local pack. They feel invincible. But then, they drive two miles down the road to grab lunch, search again, and they’ve completely vanished from the map. They haven’t just dropped to #2; they aren’t even in the top 20. This is the reality of google business profile seo in 2025. Ranking isn’t a single, static number assigned to your business; it is a geographic footprint that fluctuates with every step a potential customer takes.
The “Simple Move” I’m going to share today isn’t about changing a setting in your dashboard or adding a keyword to your description. It’s about changing how you perceive and measure your visibility. If you want to rank google business profile assets effectively, you have to stop looking at spreadsheets and start looking at grids. You need to see where your pins actually land in different zip codes, neighborhoods, and street corners.
Why Your Current Rank Tracker is Lying to You
Most business owners and even many “SEO experts” are still relying on traditional rank tracking tools. These tools typically provide a “city-level” rank. They tell you that you are #3 for “Plumber in Chicago.” But Chicago is 234 square miles. Being #3 in Chicago usually means you are #3 at the specific latitude and longitude the software uses as the “centroid” of the city – often the city hall or a major post office. For the other 99% of the city, that rank is completely irrelevant.
Traditional tools report a “blended average” that hides local losses. You might see a report saying your average rank is 4.5, which sounds decent. However, that average could be composed of a #1 rank at your office and a #40 rank everywhere else. This is why your map tracker shows you at the top while customers can’t find you. If you are relying on these national or city-level local seo ranking tools, you are essentially flying blind. You’re making strategic decisions based on a data point that doesn’t reflect how users actually interact with Google Maps.
In the world of local search, proximity is the #1 ranking factor. Google’s primary goal is to provide the most relevant, nearby solution to the user. Because of this, your visibility is a living, breathing heatmap. To truly understand your performance, you must move beyond the single-point tracking method and embrace a more granular, geographic approach.
The “Simple Move”: Transitioning to Geo-Grid Tracking
The solution to the proximity paradox is Geo-Grid Rank Tracking. Instead of checking your rank from one location, a geo-grid tracker performs simulated searches from dozens of different points across a map. This is the “simple move” that separates the amateurs from the pros. By using a google maps rank tracker, you can visualize exactly how your rankings decay as you move further from your physical location.
So, how does it work? These tools use simulated geolocation to “ping” Google’s servers from specific latitude and longitude coordinates. A standard grid tracker typically runs 25 to 49 simulated searches per keyword (source: Wiremo). Imagine a 5×5 or 7×7 grid laid over your city. Each node on that grid represents a search performed by a potential customer standing on that exact spot. Tools like SEO Viper Tools allow you to drop a pin on your business and instantly see a visual representation of your reach across various zip codes.
When you use a google maps rank tracker, you stop guessing. You can see that you dominate the north side of town but are completely invisible to the south. This data is actionable. It tells you exactly where you need to focus your local link building, where you need more reviews from customers, and where you might need to create hyperlocal content. Without this grid, you’re just throwing spaghetti at the wall and hoping it sticks in the right zip code.
How to Read a Map Pack Heatmap (The Stoplight System)
Once you run a geo-grid report, you’ll be presented with a heatmap. I always tell my clients to think of this as a stoplight system. It’s the easiest way to perform a google business profile audit at a glance.
- Green (1-3): The Money Zone. If a node is green, you are appearing in the “Business 3 Pack.” This is where the magic happens. Research shows that service-area businesses often see 60-80% of their leads come from the specific zones where they appear in the top 3. If you aren’t green, you’re likely not getting the call.
- Yellow (4-10): The Brink. You are relevant, but you’re being out-competed. Usually, this is a result of either proximity (you’re just a bit too far) or a lack of authority compared to the competitors in that specific pocket. These are your biggest opportunities for growth.
- Red (11+): Invisible. To the google map pack rankings, you effectively do not exist in these areas. You are buried so deep in the “More Businesses” list that no one is ever going to find you.
Understanding this heatmap is vital because it changes your goal. Instead of “ranking higher,” your goal becomes “expanding the green.” You want to push that green circle outward, capturing more territory and more zip codes. If you see a sea of red, it’s a sign that your current Map Pack Entry Strategies are failing to build enough local relevance to overcome the proximity factor.
3 Steps to Fix Your “Red Zones” and Expand Your Reach
Once you’ve identified your red and yellow zones through a google maps ranking service, it’s time to get to work. You can’t move your building, but you can move your digital relevance. Here are three proven steps to turn those red zones green:
1. Hyperlocal Content and City Pages
If you aren’t ranking in a specific zip code, it’s often because Google doesn’t associate your business with that specific area. To fix this, create dedicated service area pages or “city pages.” These shouldn’t be thin, duplicate content. They need to be hyperlocal. Mention local landmarks, specific neighborhood names, and even local events. This helps build the “Geographic Relevance” part of the local seo ranking factors. If you want to know how to build city landing pages that actually capture traffic, focus on providing value to the specific residents of those “Yellow” zones.
2. Local Citations and Neighborhood Signals
Consistency is key. Ensure your nap consistency seo (Name, Address, Phone number) is rock solid, but go a step further. Seek out citations from neighborhood-specific directories or local blogs in the areas where you are struggling. If there is a “Heights Neighborhood Business Association,” and you want to rank in the Heights, you need to be on that list. These local signals tell Google that your business is a trusted entity within that specific geographic pocket.
3. Geo-Tagged Media and Localized Proof
This is a secret weapon in google business profile optimization. When you or your team are out in the field – specifically in those red or yellow zones – take photos. Upload those photos to your Google Business Profile. Google can read the metadata (EXIF data) of these images, which includes the GPS coordinates of where the photo was taken. By consistently uploading photos from various parts of your service area, you are providing Google with “proof of presence” in those locations. This is a powerful way to fix why your business profile isn’t showing up for important local searches far from your office.
Recommended Tools for Zip-Code Level Tracking
To execute the “simple move,” you need the right kit. There are several local seo tools on the market, ranging from free trials to enterprise-level software. In my experience, you get what you pay for when it comes to data accuracy.
- SEO Viper Tools: This is my go-to for deep audits and precise grid tracking. It’s designed for those who need to see the “why” behind the “where.” Their google business profile audit tool is essential for identifying the gaps in your geographic coverage.
- BrightLocal: A solid all-in-one platform that offers great local search grid reports. It’s very user-friendly for small business owners.
- Semrush Map Rank Tracker: If you are already using Semrush for your national SEO, their map rank tracker is a convenient add-on that provides reliable heatmap data.
- Localo or Local Rank Guru: These are great budget-friendly options for those just starting to explore geo-grid tracking. They offer a simple way to see where your business really ranks without walking the neighborhood.
Regardless of which local seo software you choose, the key is consistency. Run your grid reports at least once a month. Local SEO is a moving target; your competitors are constantly optimizing, and Google’s algorithm is always shifting the weight of proximity.
Conclusion: Stop Flying Blind in the Map Pack
The “Simple Move” of transitioning to geo-grid tracking is more than just a technical upgrade; it’s a mindset shift. You have to stop thinking about the city as a whole and start thinking about it as a collection of neighborhoods and zip codes. If you don’t know where your pins are showing up, you don’t have a local seo strategy – you have a hope and a prayer.
By visualizing your reach through heatmaps, you can identify your “Money Zones” and your “Opportunity Zones.” You can stop wasting time on broad strategies and start implementing surgical fixes in the areas that will actually move the needle for your bottom line. Don’t let your competitors own the zip codes that should be yours. Run a grid scan today, see your real standing in the google map pack, and start turning those red zones green.
Ready to see your real rankings? Head over to SEO Viper Tools and run your first comprehensive gmb ranking service audit to dominate your local market.